

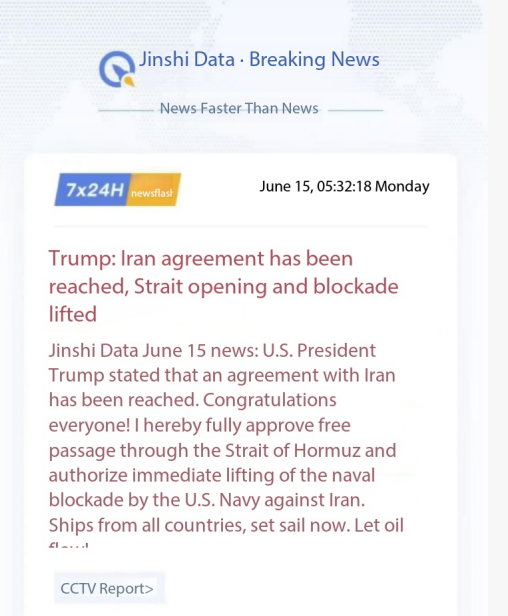
1. US-Iran June 15 Memorandum Triggers Sharp Correction in Global Crude Oil Benchmarks
Global energy and chemical markets face drastic shifts after Iran and the U.S. confirmed a finalized memorandum on June 15, 2026.
The two nations plan to formally ink the full agreement in Switzerland this coming Friday, June 19, per official disclosures from both sides.
Negotiations split into two distinct phases to resolve military conflicts and restart long-term economic diplomatic dialogue smoothly.
Phase one targets immediate ceasefires and full removal of U.S.-imposed maritime blockades across the Strait of Hormuz waterway.
Phase two launches a 60-day formal negotiation covering total U.S. sanction relief, nuclear programs and Iran’s national economic reconstruction.
Donald Trump publicly validated the finalized bilateral deal and announced unrestricted free passage for all oil tankers in the Strait of Hormuz.
Geopolitical risk premiums built up from prolonged Middle East tensions retreated rapidly to pull international crude benchmarks lower.
NYMEX July crude futures slumped to $87.71 per barrel, while ICE August Brent crude settled at $87.33 per barrel on market screens.
Downstream petrochemicals tracked crude losses, with the overall PE price index dropping more than 2% within the current calendar month.
2. LLDPE Market Weakens on Lower Crude Support, Restarted Supply and Offseason Agricultural Demand
2.1 Domestic China LLDPE Spot Index Drops Steadily Amid Weak Cost Backing
Crude oil acts as the top upstream cost foundation for all polyethylene (PE) grades, transmitting price volatility fast to plastic resin markets.
As of June 12, the national linear low-density polyethylene (LLDPE) index stood at 8401 yuan per metric ton nationwide.
This latest index reading marked a 3.18% decline versus May’s same date and a 2.11% drop against May’s full monthly average level.
2.2 Regional LLDPE Spot Quotations Slide with Thin Trading and Aggressive Trader Discounts
North China film-grade LLDPE offers range from 8130 to 8400 yuan/MT amid slow end-user purchasing activity this month.
East China spot prices sit between 8300 and 8950 yuan/MT, while South China quotes reach 8450 to 9050 yuan per metric ton.
LLDPE traders across all three core Chinese regions struggle to clear inventory and cut prices flexibly to attract rare spot orders.
2.3 Surging Domestic LLDPE Supply Meets Historic Low Offseason Downstream Consumption
Major polyethylene plants that underwent scheduled spring maintenance resumed full stable operation starting June 8 this year.
Ningxia Baofeng’s 300,000-ton full-density PE unit and Inner Mongolia Baofeng’s 500,000-ton No.1 line restarted production simultaneously.
Restarted factory output quickly lifted domestic PE supply pressure with no matching growth in downstream manufacturing demand.
Agricultural film, LLDPE’s largest end-use sector, enters its annual demand trough with operating rates falling to roughly 10%.
Film manufacturers hold minimal new order books and delay raw material purchases to deplete existing finished product stockpiles.
Around 60% of plastic market participants predict extended downside for LLDPE prices amid weak demand and shrinking crude support.
3. Polypropylene (PP) Loses Price Upside as Tight Middle East Supply Expectations Fade
Early 2026 Middle East supply disruptions from regional military blockades kept global PP supply fundamentals tight for months.
Global polypropylene plant operating rates lingered near a subdued 60% range, draining warehouse inventories and sustaining high spot PP prices.
Growing optimism over the finalized U.S.-Iran memorandum erased supply fears and removed core bullish drivers for PP resin pricing.
As of June 11, the national Chinese PP yarn grade average spot price reached 9764 yuan per metric ton on official tracking data.
Upstream crude’s persistent downward movement significantly weakens production cost support for all polypropylene manufacturing facilities.
The post-618 e-commerce packaging procurement window fully closed, leaving downstream converters focused on inventory digestion only.
Packaging factories refuse large-scale raw material restocking, resulting in muted overall spot trading activity countrywide.
The global polypropylene market faces an additional 4.6 million tons of new production capacity scheduled to launch through late 2026.
Gradual release of new PP capacity will amplify supply surplus and push resin prices further into cost-demand double weakness territory.
Polypropylene is now exiting its tight-supply high-price phase and shifting toward a bearish market cycle for the second half of 2026.
4. Global Container & Dry Bulk Shipping Freight Rates Hit Multi-Year Peaks Despite Slumping Plastic Resin Prices
Sharp losses in PE and PP spot prices contrast starkly against record-breaking continuous gains across global ocean shipping freight markets.
The Shanghai Containerized Freight Index (SCFI) has recorded seven consecutive weekly increases through June 12, 2026.
SCFI closed at 2,985.22 index points on June 12, jumping 9.49% week-on-week across all major international container trade lanes.
All four key deep-sea shipping routes posted robust weekly freight surges led by European lane’s 15.57% price jump this cycle.
Trans-Pacific West Coast freight rose 12.06% week-on-week, while Trans-Pacific East Coast rates climbed a further 10.1%.
European container freight hit $3,064 per TEU, with Mediterranean lane rates spiking to $4,172 per twenty-foot equivalent unit.
Persian Gulf shipping lanes maintain elevated freight of $4,816 per TEU due to incomplete normalisation of Strait of Hormuz transit.
The Baltic Dry Index (BDI) previously rallied to a two-year high before a mild pullback to 2,729 points on June 12 trading sessions.
Even after recent mild corrections, the overall dry bulk freight benchmark remains far higher than average levels seen throughout 2025.
5. Five Fundamental Drivers Sustaining Unprecedented Global Maritime Freight Inflation
5.1 Red Sea Shipping Disruptions Force Costly Cape of Good Hope Vessel Diversions
The core root of inflated ocean freight lies in unresolved Red Sea supply chain chaos stemming from repeated Houthi armed vessel attacks.
The one-year-long Red Sea crisis persists post U.S.-Iran deal, preventing full resumption of Suez Canal transit for commercial cargo ships.
Roughly 85% of UK international seaborne cargo fleets divert south around Africa’s Cape of Good Hope to avoid attack risks.
Each diverted voyage adds seven to ten extra sailing days plus approximately $1 million in accumulated trip-level operating costs.
Extra expenses cover increased fuel consumption, extended crew contracts and sharply elevated war risk marine insurance premiums.
Carriers pass these hidden voyage surcharges to importers, adding $500 to $1,500 in per-container extra logistics fees.
Permanent diversion costs rebuild the entire global import supply chain’s baseline cost structure for all traded petrochemical goods.
5.2 Strait of Hormuz Vessel Capacity Losses Require Long Lead Times for Full Recovery
While the U.S. and Iran agreed to open the Strait of Hormuz, full normalized shipping transit cannot materialize instantly.
Vessel schedule rearrangements, insurance repricing and cargo voyage rescheduling all demand weeks of operational adjustment time.
Daily tanker and container vessel throughput through the strait stays far below pre-conflict standard operational volumes currently.
Global usable seaborne cargo capacity has seen a permanent 15% to 20% reduction from prolonged Hormuz transit restrictions.
5.3 2026 Annual Freight Baseline Is Permanently Elevated Versus 2025 Historical Averages
The SCFI composite index fluctuated between 3,200 and 4,800 points across the first six months of the 2026 calendar year.
The average 2026 SCFI reading stands 18% higher year-on-year versus equivalent January–June data from 2025.
Even minor weekly freight pullbacks take place on a much higher cost base than importers faced last full calendar year.
5.4 Early Season U.S. Pre-shipment Demand Front-Loads Trans-Pacific Container Cargo Volumes
Major ocean carriers successfully implemented peak season surcharges on all eastbound Trans-Pacific shipping lanes in June 2026.
U.S. retail distributors rush to ship inventory early to hedge against potential new Trump administration import tariff hikes.
Market forecasts predict new tariff rates of 10% or higher for a wide basket of Asian manufactured plastic consumer goods.
Forward-shifted import demand creates temporary tight vessel availability and pushes spot container freight quotes steeply upward.
5.5 European Port Congestion and Fuel Surcharges Compound Total Logistics Cost Burdens
Mass rerouting of Asia-Europe vessels via the Cape of Good Hope creates severe backlogs at Eastern Mediterranean container terminals.
Fluctuating crude prices lift marine fuel surcharges added by shipping lines onto every plastic resin import shipment globally.
Port waiting fees, congestion surcharges and fuel levies collectively expand total landed costs for plastic raw material buyers.
6. Petrochemical Traders Face Dual Margin Compression: Lower Resin Prices and Uncontrollable Freight Costs
Plastic import and export traders operate under severe dual-sided profit pressure from opposing resin and freight market trends.
PE and PP spot prices slide lower month-over-month yet remain elevated compared to multi-year historical average price levels.
Surging ocean freight surcharges absorb most gross profit margins previously earned by petrochemical trading enterprises.
A Malaysian Manufacturing Federation survey of 225 local factories documented freight cost hikes ranging from 20% to 50%.
86% of surveyed Malaysian manufacturers face extended transit times caused by mandatory Cape of Good Hope shipping diversions.
Standard Asia-Europe transit windows stretched from 25–30 days up to 35–45 full sailing days per cargo shipment.
Naphtha feedstock prices remain stubbornly high despite crude corrections, keeping baseline plastic manufacturing costs supported.
Middle East geopolitical uncertainties linger, and regional petrochemical plant run rates have not fully recovered pre-conflict output levels.
The Middle East hosts roughly 35% of global polyethylene capacity and 28% of worldwide polypropylene production infrastructure.
Even after the U.S.-Iran memorandum, Middle Eastern plastic resin export volumes will take months to return to pre-blockade norms.
7. Mid-Term PE PP & Crude Market Outlook Tied to 60-Day Second Phase U.S.-Iran Negotiations
Iranian authorities confirmed phase-two bilateral talks will cover complete removal of both primary and secondary U.S. cross-border sanctions.
Full sanction relief will only activate after both governments finalize and ratify a comprehensive long-term bilateral diplomatic treaty.
Medium-term directional trends for crude oil, PE and PP spot prices hinge entirely on tangible progress from the 60-day negotiation window.
Current petrochemical market conditions feature weakening crude cost support paired with rigid structural logistics freight inflation.
Falling plastic resin sale prices and uncontrollable maritime shipping costs continuously erode gross margins for all plastic trading firms.
Industry analysts advise close tracking of three core variables to capture accurate near-term market movement signals.
Key monitoring metrics include phase-two U.S.-Iran negotiation pace, Strait of Hormuz transit recovery speed and Red Sea vessel risk assessments.
While upstream crude cost headwinds recede slightly, structural supply chain freight inflation remains the dominant industry cost pressure.
Conclusion
The landmark June 15 U.S.-Iran memorandum rewrites short-term trajectories for crude oil, LLDPE and polypropylene global pricing cycles.
Geopolitical risk relief triggers resin price declines, yet unresolved Red Sea and Hormuz shipping chaos sustain record freight rate peaks.
Plastic traders bear the full brunt of this market divergence as shrinking resin profits get eliminated by inflated container logistics fees.
All petrochemical market stakeholders must track 60-day bilateral negotiation outcomes to predict six-month crude and plastic price direction accurately.